How I Cut Initial JavaScript Without Cutting Features
A measured Next.js performance pass that moved optional code out of initial routes and added budgets to keep the improvements from regressing.
- Next.js
- Turbopack
- Bundle Analysis
- Web Performance
“This package looks large” is not a performance finding.
A dependency can appear in the build and still stay out of the route a visitor opens. A smaller package can enter every page through the wrong client boundary. A beautiful analyzer treemap can show composition without proving that initial navigation improved.
I wanted the bundle work across Portfolio, Studio, Admin, and Auth to answer one practical question: what JavaScript does a person pay for before they use the feature that needs it?
Start with two different measurements
I captured a clean production baseline with Next.js’s native Turbopack analyzer. The four applications initially emitted this much compressed client JavaScript:
| Application | Emitted client JavaScript |
|---|---|
| Portfolio | 328.7 KiB |
| Studio | 511.3 KiB |
| Admin | 371.0 KiB |
| Auth | 309.3 KiB |
Whole emitted output is useful, but it is not the same as a route’s initial download. A lazy feature chunk still exists in the build; it simply stops blocking a user who has not asked for the feature.
So I measured both:
- compressed JavaScript emitted by each application;
- gzip size of the chunks referenced by a specific route’s client entry manifest.
I also used the official Next.js bundle analyzer through a Webpack build for visual inspection. It helped me understand dependency composition, but the deployed Turbopack graph remained the evidence because that is what production builds.
The largest Portfolio cost was a boundary
Small About and Contact exports lived inside a 586-line client-only homepage component. Importing those exports pulled the homepage’s client boundary and Framer Motion into routes that did not need either.
The source looked reusable. The runtime graph was not.
I split certificates, contact, pointer tracking, and reveal behavior into focused components. The homepage became server-renderable again, with client islands only where interaction required them. Progressive CSS replaced reveal and parallax behavior that did not need an animation runtime.
Portfolio’s emitted compressed client JavaScript fell from 328.7 KiB to 265.4 KiB: 63.3 KiB less, or 19.3 percent. Raw output moved from 993.3 KiB to 858.7 KiB.
The lesson was not “remove animation.” It was “do not let a server-renderable route inherit a large client runtime because of where an export lives.”
Optional behavior should create optional cost
The two clearest Studio wins came from features that were valuable but not required on first load.
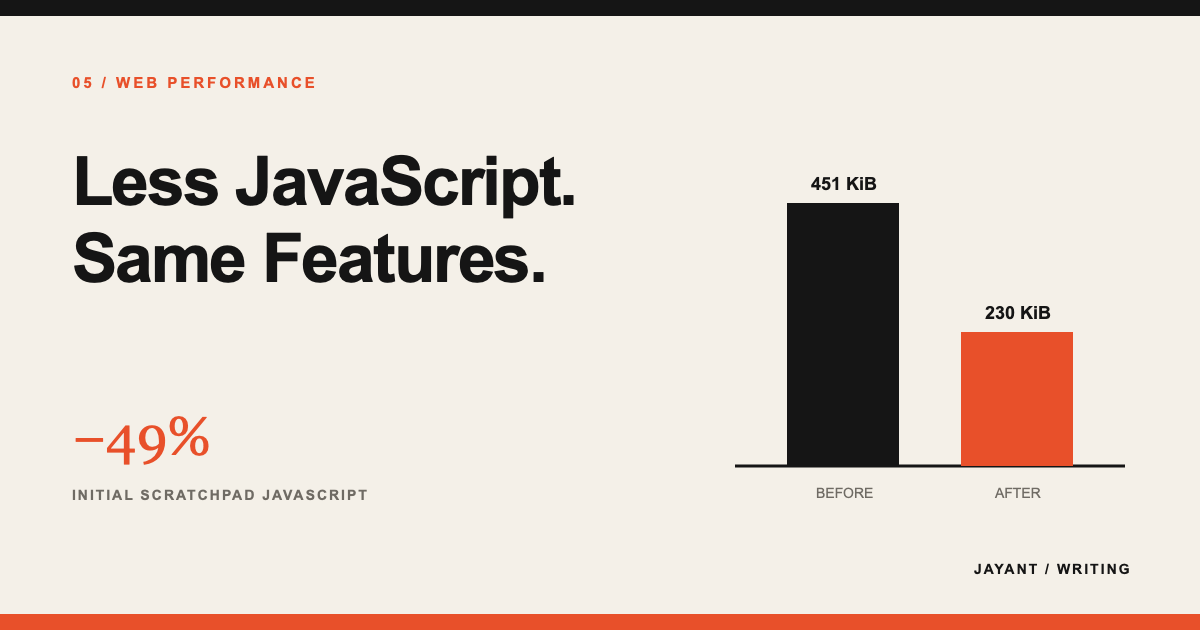
Scratchpad supports ordinary notes, links, and code. Prism syntax highlighting matters only after a code entry is expanded. It originally entered the initial route with both themes. Moving the renderer behind a route-local dynamic import reduced initial route JavaScript from 451.0 KiB to 230.3 KiB gzip—a 48.9 percent reduction.
Calculator history has PDF export. A person can browse calculations and open details without creating a PDF. Loading jsPDF only when export is requested reduced initial route JavaScript from 356.1 KiB to 224.3 KiB gzip—a 37.0 percent reduction.
Nothing was removed from the product. The cost moved to the interaction that justifies it.
Remove abstraction when it provides no behavior
The Personal Information generator used TanStack Table for a fixed result. There was no sorting, filtering, grouping, pagination, or virtualization.
I replaced it with direct rendering through existing shared table primitives. The route kept the same semantics and appearance while its initial entry fell from 389.2 KiB to 376.7 KiB gzip—a smaller 3.2 percent improvement, but a useful design correction.
A library earns its runtime and maintenance cost by providing behavior. Rendering rows is not enough by itself.
Turn the measurement into a guardrail
A one-time optimization report becomes stale the moment another import lands.
The repository now regenerates production builds and native analyzer output before checking compressed whole-client budgets:
| Application | Measured | Budget |
|---|---|---|
| Portfolio | 265.4 KiB | 280.0 KiB |
| Studio | 511.3 KiB | 525.0 KiB |
| Admin | 371.0 KiB | 385.0 KiB |
| Auth | 309.3 KiB | 320.0 KiB |
It also checks focused route ceilings:
- Scratchpad: 250 KiB gzip;
- Calculator history: 245 KiB gzip;
- Personal Information generator: 400 KiB gzip.
These are regression limits around a known-good build, not universal performance targets. The measured headroom allows ordinary changes while making a material reversal fail visibly.
What I deliberately left alone
Admin and Auth were already close to the shared Next.js and React application floor in the measured graph. I did not remove a useful library to claim a smaller total without a clear user benefit.
I also did not report Studio’s whole emitted output as reduced when optional chunks became lazy. Those chunks still exist. The route-entry metric is the honest place to report the improvement.
Performance work becomes credible when the claim, metric, and user action describe the same thing.
The result
The largest improvements came from four boundary decisions:
- server-renderable Portfolio content stopped inheriting the homepage client runtime;
- code highlighting loads when code is opened;
- PDF generation loads when export is requested;
- a fixed table no longer pays for behavior it does not use.
The analyzer showed where to look. Route manifests proved what initial navigation downloaded. Budgets made the result durable.
That is the pattern I now use for bundle work: measure the production graph, connect cost to a user action, change the boundary, and make the improvement enforceable.
Explore the Portfolio architecture or read how I measured complete product interactions.